send link to app
Audiograph - Waveform and Frequency Oscilloscope app for iPhone and iPad
4.3 (
5373 ratings )
Productivity
Music
Developer: numeric-media.com / Thomas Ploentzke
5.99 USD
Current version: 1.0, last update: 7 years agoFirst release : 01 Aug 2012
App size: 718.14 Kb
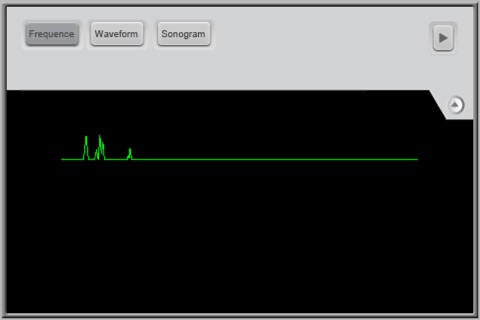
Audiograph puts audio into high quality graphs. It allows you to observe the incoming signals as:
- Waveform
- Frequency
- Sonogram
- 3D View
You can alter the time domain for in- and decreasing the visible samples. You can freeze the graph to have a more detailed view and it also allows you to modify the colors to your needs.
Possible exercises are analyzing acoustical environments (e.g. field recording), tone-shaping and equalizing assistance for musical instruments like guitar, bass, modular synthesizers... you name it.
0101001001101111011000110110101100100000011011110110111000100001
Have fun!


